Grad rates, SAT scores, & Developmental
Education figures send mixed messages
What
if we are fooling ourselves? (And our students?)
For many years the Colorado Department
of Higher Education presented a “Legislative Report on Remedial Education.” Between
2010 and 2015 these reports fairly screamed the distressing news that over a
third of our high school students – those who had graduated, mind
you, and sought to enroll in higher education in Colorado – were found to need
remedial courses in three subjects: reading, writing, or math, or a combination
of all three.
(Over 15 years ago, for three semesters, I taught Developmental Reading
090 at Arapahoe Community College. This course, along with Developmental
Writing, no longer exists.)
Many of you today will be unfamiliar with the attention we gave back
then to remediation rates. Addendum A provides a brief history: 1) headlines
from The Denver Post and Chalkbeat Colorado; 2) Another View’s
frequent use of the grim statistics to emphasize the need for change in our
high schools. At the time, remediation rates became shorthand for talk about reform,
accountability, and school restructuring or closure.
In 2019, the Colorado legislature responded. It passed HB-1206, “Higher
Education Supplemental Academic Instruction.” Policymakers decided too many
students enrolling in our colleges were being judged, unfairly, as not ready
for college level work. As a result, these students were then compelled to take
a remedial class, one that cost time and money, and earned no college credit.
One component of HB-1206 was this charge to higher education: “directly enroll no more than 10 percent of students
enrolling in the institution into stand-alone developmental education courses
that may extend the student's time to degree.” (More on HB-1206 at Addendum
B.)
By 2021 CDHE had abandoned any Remedial Education reports. Its new annual
report, “Postsecondary Access and Success For Colorado’s High School
Graduates,”[i]
reveals the significant drop in the number of students taking remediation, or
developmental education, classes.
% of High School Graduates at In-State Public Institutions with
Developmental Education Needs – 2010 – 2021
|
|
High
school grads enrolling in-state
|
Total
Requiring Developmental Education
|
%
Requiring Development …
|
|
English
|
Math
|
Both
subjects
|
|
2010
|
22,297
|
8,817
|
23.8%
|
33.5%
|
39.5%
|
|
2017
|
21,234
|
7,383
|
19.4%
|
29.5%
|
34.8%
|
|
2020
|
20,252
|
6,119
|
12%
|
27.4%
|
30.2%
|
|
2021
|
19,464
|
3,281
|
5.5%
|
14.9%
|
16.9%
|
From 2010 to 2020 - Over 5,500
fewer students assessed as needing developmental education.
From 2020 to 2021 - Roughly
3,000 fewer students assessed as needing developmental education.
Quite a change, yes?
The facts are clear. The why is not. This is where we might be
fooling ourselves.
In its 2021 report, CDHE gave two main
reasons for this remarkable decline.
CDHE – Part 1 – Developmental Education Needs
“These positive changes can in part be
attributed to K-12 better preparing students for college in addition to
policy changes which includes the uses of multiple measures to assess
developmental need.” (p. 30).[ii] (Bold mine)
Two separate points there. The second,
“policy changes which includes multiple measures,” is credible. In accord with HB–1206, colleges now offer a variety of ways to assess new students. More on
that later.
But the idea that our high school students
are now “better prepared for college” is not supported by any evidence.
Study the declining percentages over 12
years across the state— and the recent change. Then consider three
low-performing districts. (All are featured in Addendum A for their alarmingly-high
remediation numbers 10 years ago, and in Addendum E – high school
students on a READ plan).
Percentage of
students requiring Developmental Education – 2010-2021*
|
|
2010
|
2011
|
2012
|
2013
|
2014
|
2015
|
2016
|
2017
|
2018
|
2019
|
2020
|
2021
|
|
STATE
|
39.5
|
38.2
|
35.6
|
33.2
|
33.8
|
35.0
|
35.9
|
34.8
|
25.9
|
26.7
|
30.2
|
16.9
|
*Out of total of graduates
from Colorado public high schools “who enrolled in a Colorado postsecondary
institution.” https://cdhe.colorado.gov/data-and-research/tools/data-tools/pathways-to-prosperity-postsecondary-access-and-success-for
Percentage of
students requiring Developmental Education – 2010-2021
|
|
2010
|
2012
|
2014
|
2016
|
2018
|
2019
|
2020
|
2021
|
|
Adams 14
|
79.7
|
70.2
|
59.5
|
67.8
|
46.3
|
45.0
|
52.9
|
14.8
|
|
Aurora Public Schools
|
62.3
|
52.0
|
51.3
|
49.6
|
33.1
|
39.3
|
46.7
|
12.9
|
|
Westminster
|
61.4
|
59.1
|
58.3
|
61.8
|
44.5
|
52.1
|
52.2
|
22.1
|
Under the
old structures, most of the graduates from these districts were found to need
remedial education courses. The percentages were fairly consistent for a
decade, until our colleges put in place those “multiple measures” to assess new
students. Then the huge drop after 2020.
Does that drop mean that high schools
in these districts were suddenly doing a (remarkably!) better job of preparing their seniors for college-level work in 2021?
Of course not. One piece of evidence: between 2017 and
2024 SAT scores dropped off across the state, but fell even farther in these three
districts. (Addendum C).
Extend that question to students across the state. Was the class of 2021
(where suddenly less than 17% needed developmental education) so much stronger than
previous classes had been in their reading, writing, and math skills?
Is it possible the
“impressive” declines reveal the new approach meets the needs of students
“almost” college ready, but does not serve the thousands of recent graduates (for
example, from APS) who would like to enroll—but who need far more intensive support
than is currently available?
Another way we are fooling
ourselves
Second, I return to a comparison I have made since 2015 in order to
question our graduation rates.[iii]
First, the cheerful news from the Colorado Department of Education on
our ever-rising high school graduation rates; then, the darker news of steadily
declining SAT scores.
On Jan. 22, 2025, The Denver Post’s headline read:
“Colorado’s
high school graduation rate continues to steadily improve”
On Nov. 15, 2024, Chalkbeat Colorado’s
headline began:
“Colorado high school test scores dropped across the board.”
The trend line
shows no indication of “K-12 better preparing students for college.”
It is disingenuous to call these two trends a paradox. They send
contradictory messages. Our graduation rates do not reflect our students’ academic
skills and knowledge.
And now I am
asking, how does the graph above suggest our K-12 schools are “better preparing
students for college”? It does not. And how does this align with CDHE reporting
that fewer high school graduates–in fact, thousands fewer–now appear to
need development education courses?
The SAT
I can hear
the objections: You want to base your argument on one test, taken in the
spring of junior year? A college entrance exam, which means little to over 40%
of our juniors who are not headed for college?
A fair point.
Please bear with me for a moment.
In
Colorado, the SAT is the only consistent academic measure we have for high
school students.
Of course it is far from perfect. I consider it an especially poor match for high
schools with a large population of Free and Reduced Lunch students and English
Language Learners. (Yes, see Adams 14, APS, and Westminster. I know!)
But
consider what the Colorado Department of Education and the College Board have
to say (Addendum D) about a student’s score and what it can mean. I do
not think it wise to dismiss what the SAT tells us about college readiness.
Colorado’s Graduation Guidelines currently set a minimum score of 470 in
English (data below) and a 480 in Math “to demonstrate readiness for college
and career.” On the Math portion, the average score for Colorado juniors last
spring (this year’s senior class) was 477. In 2019 CDE reported that only
39% of 11th graders demonstrated college readiness in Math; since then, 11th
grade scores have only declined. Do we ignore such data?
All
in all, our SAT scores are meaningful. I hope more Coloradans can acknowledge this.
Reading – any
evidence high school graduates entering college have shown “progress”?
Still not persuaded that CDHE’s conclusion is wrong? Look specifically
at what we know about the reading and literacy skills of our high school students.
The total SAT figure
comes from scores on its two sections: one, Evidence-based Reading and Writing,
and the other, Math. Here we see the declining scores on the Reading and
Writing section.
|
Reading/Writing - SAT
|
2019
|
2021
|
2022
|
2023
|
2024
|
|
% Met/Exceeded Expectations
|
58.5%*
|
60%**
|
57.5%
|
58.9%
|
57.6%
|
*In 2019 CDE stated this percentage
represented those at or above the College Readiness Benchmark. **CDE now
states: “Percent Met or Exceeded Expectations.” A score of 470 Meets
Expectations.
Moreover, having looked
closely this past year at the reading/literacy skills of our high school
students, I find nothing to indicate progress on reading. Addendum E
includes recent data presented in Another View and at Boardhawk. We
can now add Colorado’s most recent NAEP scores. In 2024, only 35% of Colorado 8th
graders scored Proficient in reading, below the level reached pre-COVID:
2015: 38%, 2017:41%; 2019: 38%.
On NAEP, it is easier to score at the Basic level.
And yet the percentage of Colorado 8th graders who scored At or
Above Basic in reading, 63% in 2022, 65% in 2024, is the lowest it has been since 1996.[iv]
Those 8th graders NAEP tested? They are now our high school juniors and
freshmen.
Again, where is the evidence that today’s K-12 students are “better prepared
for college”?
One more look at the
CDHE report – over 3,500 fewer students need Developmental English
Given these disturbing facts on the reading/literacy skills of our secondary
students, one page in the CDHE “Pathways to Prosperity” report is especially hard
to understand.
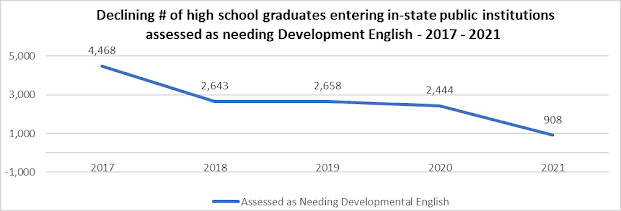
Part 2 of the report breaks down the decrease in the number of students needing
developmental education by subject. The data below is from the page on
Developmental English.[v] Given CDE’s data on the performance of our high school students in Reading and
Writing, how does this make sense?
In just five years, from 4,468 down to 908
students assessed as needing Developmental English. 3,500 fewer students.
So we now let students decide if they are "college ready"?
Why might both CDE's graduation figures and higher education’s Development
Education rates give us better news than seems warranted, in light of the decline
in high school achievement?
Here is one possibility. CDE and CDHE have both created a more expansive
set of criteria for assessing students’ knowledge and skills.
For CDE, see its Menu of (11) Options[vi].
For CDHE, see the myriad ways students can now show college readiness in
the Colorado Community College System (“Assessment for College Readiness,” Addendum
F). Note too the specific guidelines limiting the number of students
taking developmental education. Has that proved wise?
Still, I can applaud the intent. Back in 2006 and 2009, teaching
Remedial Reading classes, I too felt the Accuplacer test condemned a number of
students to a semester with me. Several could have done well, most likely, with
sufficient support, in a college-level English class.
The benefits are more choice; greater flexibility; no more “one-size
fits all.” The state is acknowledging that students can show what they have
learned in a variety of ways. So far so good.
The drawbacks, in both cases: this new more generous approach can mean almost
anything goes. I have critiqued several options in the Graduation Guidelines
before (AV #264, Endnote[vii]).
As for CDHE’s new guidelines, I have many questions. At least one option is not
an objective assessment.
|
Assessment Methods and Minimum College
Readiness Standards “Guided Self-Placement (GSP) is a locally
developed tool or process that allows students, in consultation with advisors
and/or faculty, to determine the appropriate starting coursework in
mathematics, English, and English as a Second Language. (ESL).” See an
example of a GSP – Addendum G.
|
Community colleges can now use a Guided Self-Placement; it allows
students to choose which course they should take (see box, from CCCS). As a community college department chair acknowledged
to me, our “18-year-olds don’t know what they don’t know.” Hey, I got that high
school diploma; why waste a semester taking a Developmental English course when
I can take a college level class, and it gets me the credits I need!
Could this be one reason the number “required” to take Developmental English has plunged? Who
believes a Guided Self-Placement is a meaningful “assessment” of college
readiness?
“Know thyself”
I find it foolish to interpret the dramatic drop in the number of students needing
development education as a good news story about the skills and knowledge of
our high school graduates. Rates have fallen because we have fundamentally
changed how we assess students who seek to enroll in college. That is all.
If both CDHE and CDE were more transparent
on these matters, it would surely help.
This winter I sent several questions to CDHE.
I asked why the significant decline in 2021, and if CDHE had evidence of K-12 “better
preparing students for college.” I received no answers.
And CDE was unwilling or unable to provide
data to confirm its statement that “the top
three ways Colorado students are demonstrating that they are ready for
graduation are via the SAT, enrolling in college classes, and a final capstone
project” (Colorado Public Radio, Jan. 22, 2025[viii]).
We should
know if our high school graduates can truly “demonstrate readiness for college and career” (from CDE's Menu of Options). I hope the media and others will keep asking.
Two options.
Accept the reassuring messages:
developmental education rates WAY DOWN, graduation rates ALWAYS UP.
Or, instead, try to find out what our high school students know and are able to do.
Another View takes the latter
approach. What I conclude is not reassuring.
Claims about progress do not match what
the achievement data tell us.
Nor does it match what I hear from teachers, who—well after COVID—continue to see lower expectations in their schools. More on that later this month.
Addendum A
2008 – 2021 – First front page news; then
a new law; now remediation is gone!
2008 - Dec. 28 – The Associated Press/The Denver Post[ix]
1 in 3 new college
students need remedial classes
DENVER—About 30 percent of new college
students in Colorado need remedial courses in math, reading and writing and the
number is increasing in some metro area high schools.
--
2010 – May 25 - The Denver Post
Analysis gives DPS a lesson plan
“DPS kids need help after graduation … many students who enroll in college require remedial course once they get there.”
[Chart showed 12 high schools, comparing] “the number of graduates who enroll in college to the number who do so without requiring extra help.” Bottom four high schools:
|
Percent of students from these high
schools who enrolled in college without remediation.
|
|
Abraham Lincoln H.S.
|
6%
|
|
Montbello H.S.
|
6%
|
|
North H.S.
|
4%
|
|
West H.S.
|
1%
|
--
2013 – June 9 – The Denver Post[x]
New Denver Public Schools remedial classes aimed at college
success
More than 60 percent of DPS students needed remediation once
they entered college, according to the 2012
Remedial Education Report. The number is considerably higher than the state
average of 40 percent.
Remediation courses for nearly 9,900 students in Colorado
cost about $58 million in the 2011-12 school year, according to the most
recent information available from the state. Colleges paid $19 million, while
students took on the remaining brunt of the costs.
--
2016 - May 27 – The Denver Post[xi]
More Colorado high school graduates need remediation after
entering college
|
Denver-area district remediation rates, 2017[xii]
Sheridan School
District: 74.1%
Westminster Public
Schools: 67.9%
Adams County S. D. 14: 66%
Englewood Schools: 57.4%
Aurora Public Schools: 54.2%
Mapleton Public Schools: 52.9%
Denver Public Schools: 47%
|
The number of Colorado high school graduates who
weren’t academically ready to succeed in college-level
curriculum went up during for the 2014-15 school year
--
2018 - June 20 – The Denver Post[xiii]
Report shows lower remedial education rates for Colorado
high school graduates
New
pilot program provides more help to students who need it
--
2019 - March 21 – Chalkbeat
Colorado[xiv] - "end the practice of placing students"
Phasing out remedial college education could help more
Colorado students earn their degrees - House Bill 1206 requires
that by 2022, public colleges and universities end the practice of placing
students directly into basic skills classes that don’t provide college credit,
with an exception for a small number of students who may still choose to take
those classes.
--
2019 -
Aug. 12 – The Denver Post[xv]
- “new law getting rid of remedial college courses in Colorado”
Line
between remedial, mainstream classes blurs as Colorado colleges reconsider
paths to student success - Fewer Denver
students testing into developmental classes once they reach college.… A new law
getting rid of remedial college courses in Colorado won’t take
effect until 2022, but schools already are shifting away
from a traditional sequence of lower-level classes that students have to pass
before they can start earning credits.
Another View on remediation rates – 2012-2021
Another View frequently highlighted remediation
rates in reports on low-performing high schools. Four examples below. One
included – as we see it now – a foolish prediction: “Remediation
rates suggest our graduation rates will soon fall” (from AV #183, fall 2016).
“We cannot
keep up the pretense of ‘awarding’ high school degrees that fail to reflect
what seniors know and are able to do. But if we implement the [Graduation] Guidelines
with sufficient rigor, the consequences will be huge.”
How wrong I was. Our graduation rates have climbed
ever since 2015. Lower test scores, COVID, scary figures on chronic absenteeism
– fear not! Our graduation rates just go up and up!
1.
Sept. 2012 - AV #88 – Aurora Central High - The Case for State Intervention
Colorado Public High School Graduates Assigned to Remediation in Colorado
Public Higher Education FY 2010-11 (Fall 2010 Enrollment)
|
High School
|
District
|
Remediation rates- 2011
|
# in remediation classes/ # of students from this high school attending a Colorado college
|
|
1.
West
|
DPS
|
89.6%
|
43/48
|
|
2.
Montbello
|
DPS
|
80.0%
|
76/95
|
|
3.
Abraham
Lincoln
|
DPS
|
78.3%
|
72/92
|
|
4.
Harrison
|
Harrison 2
|
75.5%
|
40/53
|
|
5.
Aurora
Central
|
Aurora
|
73.8%
|
59/80
|
|
6.
North
|
DPS
|
72.6%
|
45/62
|
|
7.
Adams City
|
Adams 14
|
71.8%
|
51/71
|
|
8.
Sierra
|
Harrison 2
|
67.6%
|
48/71
|
2.
June
2015 - AV #131 - Higher graduation rates? A word of caution before we celebrate
Listed 17 DPS high schools and their
remediation rates; five schools over 60%.
Listed five other metro areas schools
with remediation rates between 52% and 73%.
3.
Sept. 2018 – AV #182 - Remediation rates suggest our
graduation rates will soon fall
In this
newsletter you will see the even more distressing results from over 50 Colorado
schools and 17 districts—where the
majority of graduates required remediation before taking college English or
math. One extraordinary finding from the CDHE
study:
almost 31% of Colorado’s high schools have “a developmental education
rate above 50%”[xvi]—i.e.
most graduates are not “college ready.” Again, I predict that these are prime
examples of districts where the happy news about better graduation rates will
end in 2021. Assuming, that is, the new
Graduation Guidelines really mean that we take into account our seniors’
academic skills – before we award them a degree.
4. Oct.
2019 – AV #200
FACTS FOR THE STATE BOARD OF EDUCATION –
on
six urban high schools, all on the clock for (too many) years
Most
recent remediation rates. (Speaks to college readiness. Graduation rates do
not.)
|
District
|
School
|
Remediation rate
|
2017 graduates enrolled in college
|
|
|
|
2015
|
2016
|
2017
|
# of students enrolled in college that fall
|
# of students needing remediation
|
|
STATE
|
|
35%
|
35.9%
|
34.8%
|
21,234
|
7,383
|
|
Adams 14
|
Adams City
High
|
64%
|
68.5%
|
66%
|
91
|
60
|
|
APS
|
Aurora
Central
|
70%
|
65%
|
67%
|
87
|
58
|
|
|
Gateway
|
56%
|
64%
|
59%
|
75
|
44
|
|
DPS
|
Abraham
Lincoln
|
71%
|
58%
|
52%
|
96
|
50
|
|
|
Manual
|
57%
|
79%
|
69%
|
29
|
20
|
|
Pueblo 60
|
Central
|
77%
|
57%
|
61%
|
101
|
62
|
Addendum B
HB19-1206
- Higher Education Supplemental Academic Instruction
Concerning removing equity gaps in higher education by
ensuring more students
have access to supplemental academic instruction.
Bill Summary
"State institutions of higher education - requirements for developmental education and basic skills courses - supplemental academic instruction. The act directs the Colorado commission on higher education (commission)
|
“ … institutions
cannot place a student into developmental education based on a single
instrument or test.”
|
to adopt a
developmental education policy requiring the governing boards of state institutions of higher education (institutions) to maximize the likelihood of success in entry-level (gateway) college-level course work when placing students into developmental education. The act also specifies that institutions cannot
place a student into developmental education based on a single instrument or
test."
|
“ … shall directly enroll no more than 10 percent of
students enrolling in the institution into stand-alone developmental
education courses.”
|
"For institutions authorized to offer developmental
education, the act requires that, by 2022, such institutions shall directly
enroll no more than 10 percent of students enrolling in the institution into
stand-alone developmental education courses that may extend the student's time
to degree. Instead, a student should be enrolled in a gateway college-level
course with additional supports through supplemental academic instruction (SAI)
or c-requisite remediation." https://leg.colorado.gov/bills/hb19-1206
In 2020, the Colorado
Commission of Higher Education took the next step
“Memorandum.
“TO:
Colorado Public Institutions of Higher Education
“FROM:
Dr. Chris Rasmussen, Director of Academic Affairs
“DATE:
June 25, 2020.”
Begins -
“The Colorado
Commission on Higher Education has finalized revisions to its Developmental
Education policy in response to HB 19-1206 (Concerning Removing Equity Gaps in
Higher Education by Ensuring More Students Have Access to Supplemental Academic
Instruction).”
Planning and Implementation
Timelines
“For institutions authorized by statute to offer
developmental education, beginning in the 2022-23 academic year, no more than
10 percent of enrolling students shall be placed into pre-requisite
developmental education courses that delay students’ progress toward a degree.”
https://cdhe.colorado.gov/sites/highered/files/documents/Dear-Colleague%20memo%20on%20CCHE%20Dev%20Ed%20policy%20062520.pdf
Addendum C
SAT scores in
Adams 14, Aurora Public Schools and Westminster decline, 2017-2024
Statewide scores
decline by 36 points. We see an even greater decline in these three districts.
|
|
2017 (class of ’18)
|
2018 (class of ’19)
|
2019 (class of ’20)
|
|
2021
|
2022
|
2023
|
2024
|
|
Adams 14
|
858
|
858
|
833
|
|
848
|
814
|
807
|
787
|
|
Aurora Public Schools
|
892
|
901
|
879
|
|
907
|
870
|
860
|
851
|
|
Westminster
|
861
|
858
|
861
|
|
862
|
843
|
843
|
811
|
|
State average
|
1014
|
1014
|
1001
|
|
1011
|
986
|
990
|
978
|
Addendum D – The SAT
Key facts on the SAT in
Colorado
1.
Email to me from Joyce Zurkowski,
chief assessment officer, CDE – July 24, 2023.
“The SAT scores are used for a variety of purposes and indicators, such
as:
1.) college readiness based on College Board research based on first year
in college performance,
2.) how well students have achieved the expectations of the Colorado
Academic Standards that would be expected of 11th graders,
3.) reaching the endorsed
diploma/higher bar called for in statute, and
4.) having met local graduation
requirements, which is high stakes for students."
“These different uses and interpretations have resulted in different cuts
with the CO-established cuts being informed by educators and stakeholder
groups.”
|
|
College Board College
Readiness Benchmark
|
CO Met Expectations
Cut Score based on CAS and used for accountability
|
Grad Guidelines
|
|
SAT Evidence-based Reading and Writing
|
480
|
480
|
470
|
|
Math
|
530
|
530
|
500 [Revised to 480 in fall, 2024; see #2]
|
[
2. CDE - Graduation
Guidelines - Menu of Options
Menu of College and Career-Ready Demonstrations
Students must
demonstrate readiness for college and career based on at least one
measure in Reading, Writing and Communicating, and one measure in Mathematics.
Reading, Writing and Communicating: 470
Mathematics: 480 *
The SAT is a college entrance
exam. The SAT includes sections on reading, writing and
math. The highest possible score for each section is 800.
*480: Beginning with
Digital SAT, 2023-24, extending through 2025-26
*500: 2022 -2023 and prior to Digital SAT -https://www.cde.state.co.us/postsecondary/grad-menu
3.
The College Board
SAT College and Career Readiness Benchmarks
“Students are considered
college and career ready when their SAT section scores meet both the Reading
and Writing and Math benchmarks.”
Benchmark Values and Section Score Ranges
College and Career
Readiness Benchmarks (SAT)
• Reading and Writing: 480
• Math: 530
https://satsuite.collegeboard.org/k12-educators/about/understand-scores-benchmarks/benchmarks
Addendum E – on the reading/literacy
skills of high school students in Colorado
1.
From my 22-page Report on Reading – “After
the READ Act – Beyond third grade, how well do our students read?”
(Feb. 2024)
a.)
A list of 30 high schools with 100 or
more students on a READ plan. (p. 11)
“No one in DPS (15
schools) or APS (6 schools) can deny that reading in their high schools should
be a top priority.”
[Related to earlier
points about Adams 14, Aurora Public Schools, and Westminster. Four of
the five high schools with the greatest number of students on a READ plan in
2021-22 were in these three districts: Westminster High (327 students), Adams
City High (239), Aurora Central High (290), and Hinkley High (225).]
b.)
Grades 9-11 –
In 2023:
·
40,000 high
school students in grades 9-11 scored at the
lowest performance level on a Reading/Writing assessment.
·
Nearly 30% of our
juniors demonstrated literacy skills that are perhaps two or more years
below grade level. Another 13.1% of 11th graders, 7,335 students,
scored Approached Expectations, perhaps one year below grade
level.
· Close to 45% of Black and Hispanic high school juniors scored Did Not Yet Meet Expectations. (p. 14)
c.) Total
– 61,904 secondary school students …
We
conclude with a full picture for grades 6-11: in 2023, a total of
61,904 students scored at the lowest performance level on Colorado’s reading
and writing assessments.
2. From
AV #276 – Sept. 2024 - an update from the Reading Report, adding the
just-released SAT scores. The number of high school students performing in the
lowest scoring category, Did Not Yet Meet Expectations, remained close
to 40,000. The percentage of juniors scoring in the lowest category increased
over 2023.
|
Reading/Writing portion of the PSAT
and SAT
|
|
|
2023
|
2024
|
|
|
Students
scoring Did Not Yet Meet Expectations
|
|
|
%
|
Number
of students
|
%
|
Number
of students
|
|
9
- PSAT
|
21.2%
|
12,391
|
18.2%
|
10,435
|
|
10
- PSAT
|
22.1%
|
12,429
|
20.3%
|
11,562
|
|
11
- SAT
|
28%
|
15,663
|
30.6%
|
17,326
|
|
|
|
40,483
|
|
39,323
|
|
*http://www.cde.state.co.us/assessment/cmas
|
It is especially alarming to see how pronounced this trend is for
students of color. By Grade 11 – nearly one-half of these students scored in
the lowest category on the Reading/Writing portion.
PSAT/SAT (9-11) - % Did Not
Meet Expectations
|
|
9 (PSAT)
|
10 (PSAT)
|
11 (SAT)
|
|
Black/African American
|
27.7
|
33.1
|
45.7
|
|
Hispanic/Latino
|
31.6
|
35.0
|
50.7
|
|
White
|
8.6
|
9.8
|
16.9
|
3.
From Boardhawk. “Data reveal
the shocking breadth and depth of Colorado’s reading crisis,” by Peter
Huidekoper Jr., Nov. 25, 2024.[xvii]
Upon
request, the Colorado Department of Education presents data on the number of high
school students still on what is called “a READ plan.” The most recent data
is from 2022-23.
Those K-3 students first served by the READ
Act 7-10 years ago are now in high school. This may surprise you: over 10,000
students are still on a READ plan in high school.
|
High
school students on a READ Plan, 2022-23
|
Grade
9
|
Grade
10
|
Grade
11
|
Grade
12
|
|
5,152
|
3,676
|
2,524
|
1,411
|
Equally disturbing: the total number has
grown. An additional 3,600 students in two years.
|
Total
number of high school students on a READ Plan
|
2021
|
2022
|
2023
|
|
9,093
|
11,127
|
12,763
|
And CDE’s
data might seriously understate the true facts. In its report for high school
students on a READ plan, data from over 140 districts is suppressed.
Addendum F
SP 9 -41 – Assessment for
College Readiness
Colorado Community College System / System Procedure
REVISED: November 15,
2021
PURPOSE
Board Policy (BP) 9-41 authorizes
the Chancellor to promulgate procedures necessary to implement assessment for
college readiness. Furthermore, this procedure is consistent with the Colorado
Commission for Higher Education (CCHE) Statewide Remedial Education Policy.
This procedure provides guidance for implementation of
assessment for college readiness in reading, writing, and mathematics of
students within CCCS.
DEFINITIONS
·
“College Readiness” is the determination that a student has
the skills necessary to be successful in a college-level course.
·
“Default Placement” is the practice of direct placement
into a college-level course with a paired SAI support course unless the student
provides evidence for college-level placement.
·
“Developmental Education” means courses that are
prerequisites to the level of work expected at a postsecondary institution and
include academic skills courses and preparatory courses.
·
“Guided Self-Placement (GSP)” is a locally developed tool
or process that allows students, in consultation with advisors and/or faculty,
to determine the appropriate starting coursework in mathematics, English, and
English as a Second Language (ESL). GSP encourages students’ personal
metacognitive evaluation and self-determination as a part of the placement
process. GSP tools provide students with basic information about multiple
measures and help them, through questions, examples, and course descriptions, determine
the appropriate level of placement aligned with the student’s educational
goals.
·
“Supplemental Academic Instruction (SAI)” means
co-requisite courses, modified co-requisite courses, and academic support
models that use peer or instructor study sessions, or individualized in-class
academic support to improve student learning, retention, or success.
PROCEDURE
Requirement for Assessment:
Degree-seeking undergraduate students
must be assessed in mathematics, writing, and reading prior to or during the
first semester of their college career.
All students (whether
degree-seeking, non-degree-seeking, concurrent enrollment, exchange students,
etc.) must be assessed in the applicable subject if they enroll in a course
that has a specific math, English, or reading prerequisite.
Exemptions from
Assessment:
Students who would normally be required to be assessed can demonstrate college
readiness or are otherwise exempt from the assessment requirement if the
student:
- Has completed either a college-level transfer
mathematics and college-level transfer writing course or a remedial course
(if required) in mathematics, writing, and reading;
- Earned a baccalaureate degree;
- Earned an associate degree;
- Is pursuing a vocational certificate, unless the
individual college requires assessment of certificate-seekers; or
- Has a combination of recent high school unweighted
GPA and related high school coursework at or above the levels established
by CCCS.
Assessment Methods and Minimum College Readiness Standards:
Colleges may use any of the primary
indicators of college readiness and cut scores as defined by the CCHE Remedial
Education Policy. Colleges may also use GSP and/or Default Placement in lieu of
other assessment methods. A student who scores at the indicated score or above,
within the five years prior to enrollment, is determined to be college ready
and therefore is not in need of college readiness instruction. If students
retake an assessment, Colleges will accept the higher of their two testing
scores, even if that is the original test score.
For students who come to CCCS as “Ability to
Benefit” students, a federally certified assessment should be used to determine
college readiness.
If a student, 1)
has not taken one of these tests to demonstrate college readiness, 2) brings a
college readiness score that falls below the CCHE identified score for a
primary indicator of college readiness, or 3) has taken a test that is more
than five years old, the student must take a CCCS-approved assessment, which
includes GSP and/or Default Placement. Students must score at or above the
levels established by CCCS on such assessment in order to be considered college
ready.
Supplemental Academic Instruction and Developmental
Education:
- Colleges must advise students in the appropriate
level course work upon assessment. Students meeting the specified minimum
cut score may enroll in college-level courses and be reported as such.
- Colleges must advise students to enroll in SAI
courses or Developmental Education/remedial skills classes during the
first semester following a placement test when assessment scores indicate
inadequate college preparation in any or all of these areas. Colleges must
advise students of their responsibility to complete SAI courses or
Developmental Education/remedial course work within the first 30 credit
hours.
- Colleges must ensure that each enrolled student
identified as needing Developmental Education or remedial course work is
provided with written notification identifying which state institutions
offer such Developmental Education courses, including online courses.
- All students whose assessment scores do not meet
the standards established by CCCS are responsible for completing
Developmental Education instruction during their first thirty (30) credit
hours of attendance at the College. For students with unmet remedial needs
who have completed 30 or more credit hours, Colleges must require that
such students meet with an academic advisor on the need to address college
readiness deficiencies before registering for additional course work.
https://cccs.edu/about/governance/policies-procedures/sp-9-41-assessment-for-college-readiness/
Addendum G
Students choose their courses
Community
College of Denver and Colorado Northwestern Community College
1.
From Community College of Denver
https://www.ccd.edu/testing-center/determine-course-placement
Determine Course Placement
Determine
which English and Math course is best for you. There are different ways to make
this determination, choose the one you are most comfortable with.
Options to Determine Your Course Placement
Option 1 - College Credit Transfer
Option 2 - High School GPA or Coursework
Option 3 - High School Equivalency Test Scores
Option 4 - ACT, SAT, or Accuplacer Scores
Option 5 - Guided Self-Placement
English
After taking this survey*, you
decide if you should take a college-level English course, a college-level
English course WITH a support course, or a pre-college level English course
first. Selecting one of these paths will help inform which English class
you will take.
Math
The EXCEL Zone offers math
boot camps in the
week preceding each fall, spring, and summer term. After completing a boot
camp, you can enroll in a gateway-level math course without a support course.
Or after
taking this
assessment, you learn
if you should take a gateway-level math course without a support course, a
gateway-level math course with a support course, or a developmental-level math
course first. Then you will select your specific class.
[*Survey –
could not download; only available to students. See the example for CNCC
below.]
2. From Guided Self-Placement used by Colorado
Northwestern Community College
https://cncc.formstack.com/forms/guidedselfassessment
OPTION 5 – Guided Self-Placement
English [This part is the same as CCD's language.]
After taking this survey, you decide if you should take a
college-level English course, a college-level English course WITH a support
course, or a pre-college level English course first....
These questions refer to your English
language ability:
|
Always (I)
|
Often (II)
|
Sometimes (III)
|
Never (IV)
|
|
I read for pleasure and for work or school.
|
|
|
|
|
|
I am confident about my ability to comprehend new or unfamiliar texts.
|
|
|
|
|
|
I have written multiple drafts of papers, revised, and edited them.
|
|
|
|
|
|
I have written papers longer than three or four pages.
|
|
|
|
|
|
I am comfortable writing papers for classes other than English.
|
|
|
|
|
|
In the past, some of my papers have required research and citation of
sources.
|
|
|
|
|
|
I am comfortable using standard written English; including correct
grammar, punctuation, and sentence construction.
|
|
|
|
|
Student Type I - If most of
your checkmarks are in the first column (I), you feel you have strong reading
and writing skills and are comfortable
taking English Composition I (ENG 1021) or Technical Writing (ENG 1020),
the first of two required college-level writing courses most students will
need. ENG 1021 focuses on analytical, evaluative, and
persuasive/argumentative writing along with reading complex texts.
Student Type
II - …
Student Type
III - …
Student Type IV - If most of your checkmarks
are in the fourth column (IV) or if you have no clear majority column, you may
feel your reading and writing skills need significant development or you are
just unsure about your skills. ENG 0091: Composition and Writing
AND ENG 0091: Composition and Reading Lab provides additional support
to allow you to increase the likelihood of your success in ENG 0092.
Using the student type descriptions
and your previous answers, select the course(s) in which you would like to
enroll.
Using
the student type descriptions and your previous answers, select the course(s)
in which you would like to enroll.
Student
Type I = ENG 1021: English Composition I
Student
Type II = ENG 1021: English Composition I and ENG 0094: Studio I21
Student
Type III = ENG 0092: Composition and Reading
Student Type IV = ENG 0091: Composition and Writing AND ENG 0092: Composition and Reading Lab
I'm
not sure. I would like to speak with an advisor.
Endnotes
[vii] Another View #264 - Colorado’s new graduation guidelines –
early warning signs that they fall short
State’s Menu of Options: greater flexibility – and a lower bar
Case
in point: District Capstones (where we have no “guidelines”)
Excerpt from #264 -
Defining our terms – the Graduation
Guidelines are flexible and expansive, but here is what they SAY
The Colorado Department of Education’s “Menu of Options” states: “Students
must demonstrate readiness for college and career based on at least one measure
in Reading, Writing, and Communication, and one measure in Mathematics.” It
defines a District Capstone as:
… the culminating exhibition of a
student’s project or experience that demonstrates academic and intellectual
learning. Capstone projects are district determined and often include a
portfolio of a student’s best work.
“District
determined” is the key phrase. For most of the other 11 options on the “Menu,”
we see a “Minimum Score Required” for demonstrating Reading, Writing and
Communicating, and for Math. In Math we see a number; for example, SAT Math
- 500; ACT Math - 19; Accuplacer Math – 61.
Even the ASVAB and ACT WorkKeys options give hard numbers as the
minimum score needed to pass.
But for the District Capstone, as CDE’s Menu of Options shows,
there is no Minimum Score. It simply states: Individualized. Districts
determine their own criteria. Thus the problem. We have no clearly defined
minimum expectation for the quality and depth of the “academic and
intellectual” learning in English and in Math that students will be
asked to demonstrate. We allow for 185 ways to “demonstrate competency.” https://anotherviewphj.blogspot.com/2023/10/av-264-colorados-new-graduation.html